Cyber Sensing for Power Outage Detection
Lincoln Laboratory developed software that rapidly estimates the locations and extent of power outages. During post-disaster relief efforts, first responders and emergency maintenance crews need an immediate and constantly updated picture of power availability in a region. With this cyber sensing approach, internet-connected devices in a targeted region are scanned to detect decreased responsiveness indicative of connectivity loss.
Challenge
In the aftermath of a major disaster, knowledge of the extent of power outages is critical to rescue efforts, humanitarian assistance, and restoration of services and infrastructure. Utilities can use smart grid technology, such as advanced metering infrastructure (AMI), to rapidly and automatically assess outages; however, while many meters currently deployed in the United States have assessment capabilities, these meters are not evenly distributed around the country. Many utilities still rely on phone calls from customers to report outages, a data collection method that is slow and often imprecise. Moreover, for responders to understand the impact of region-wide power outages, information gathered from multiple electric utilities must be coordinated.
Solution
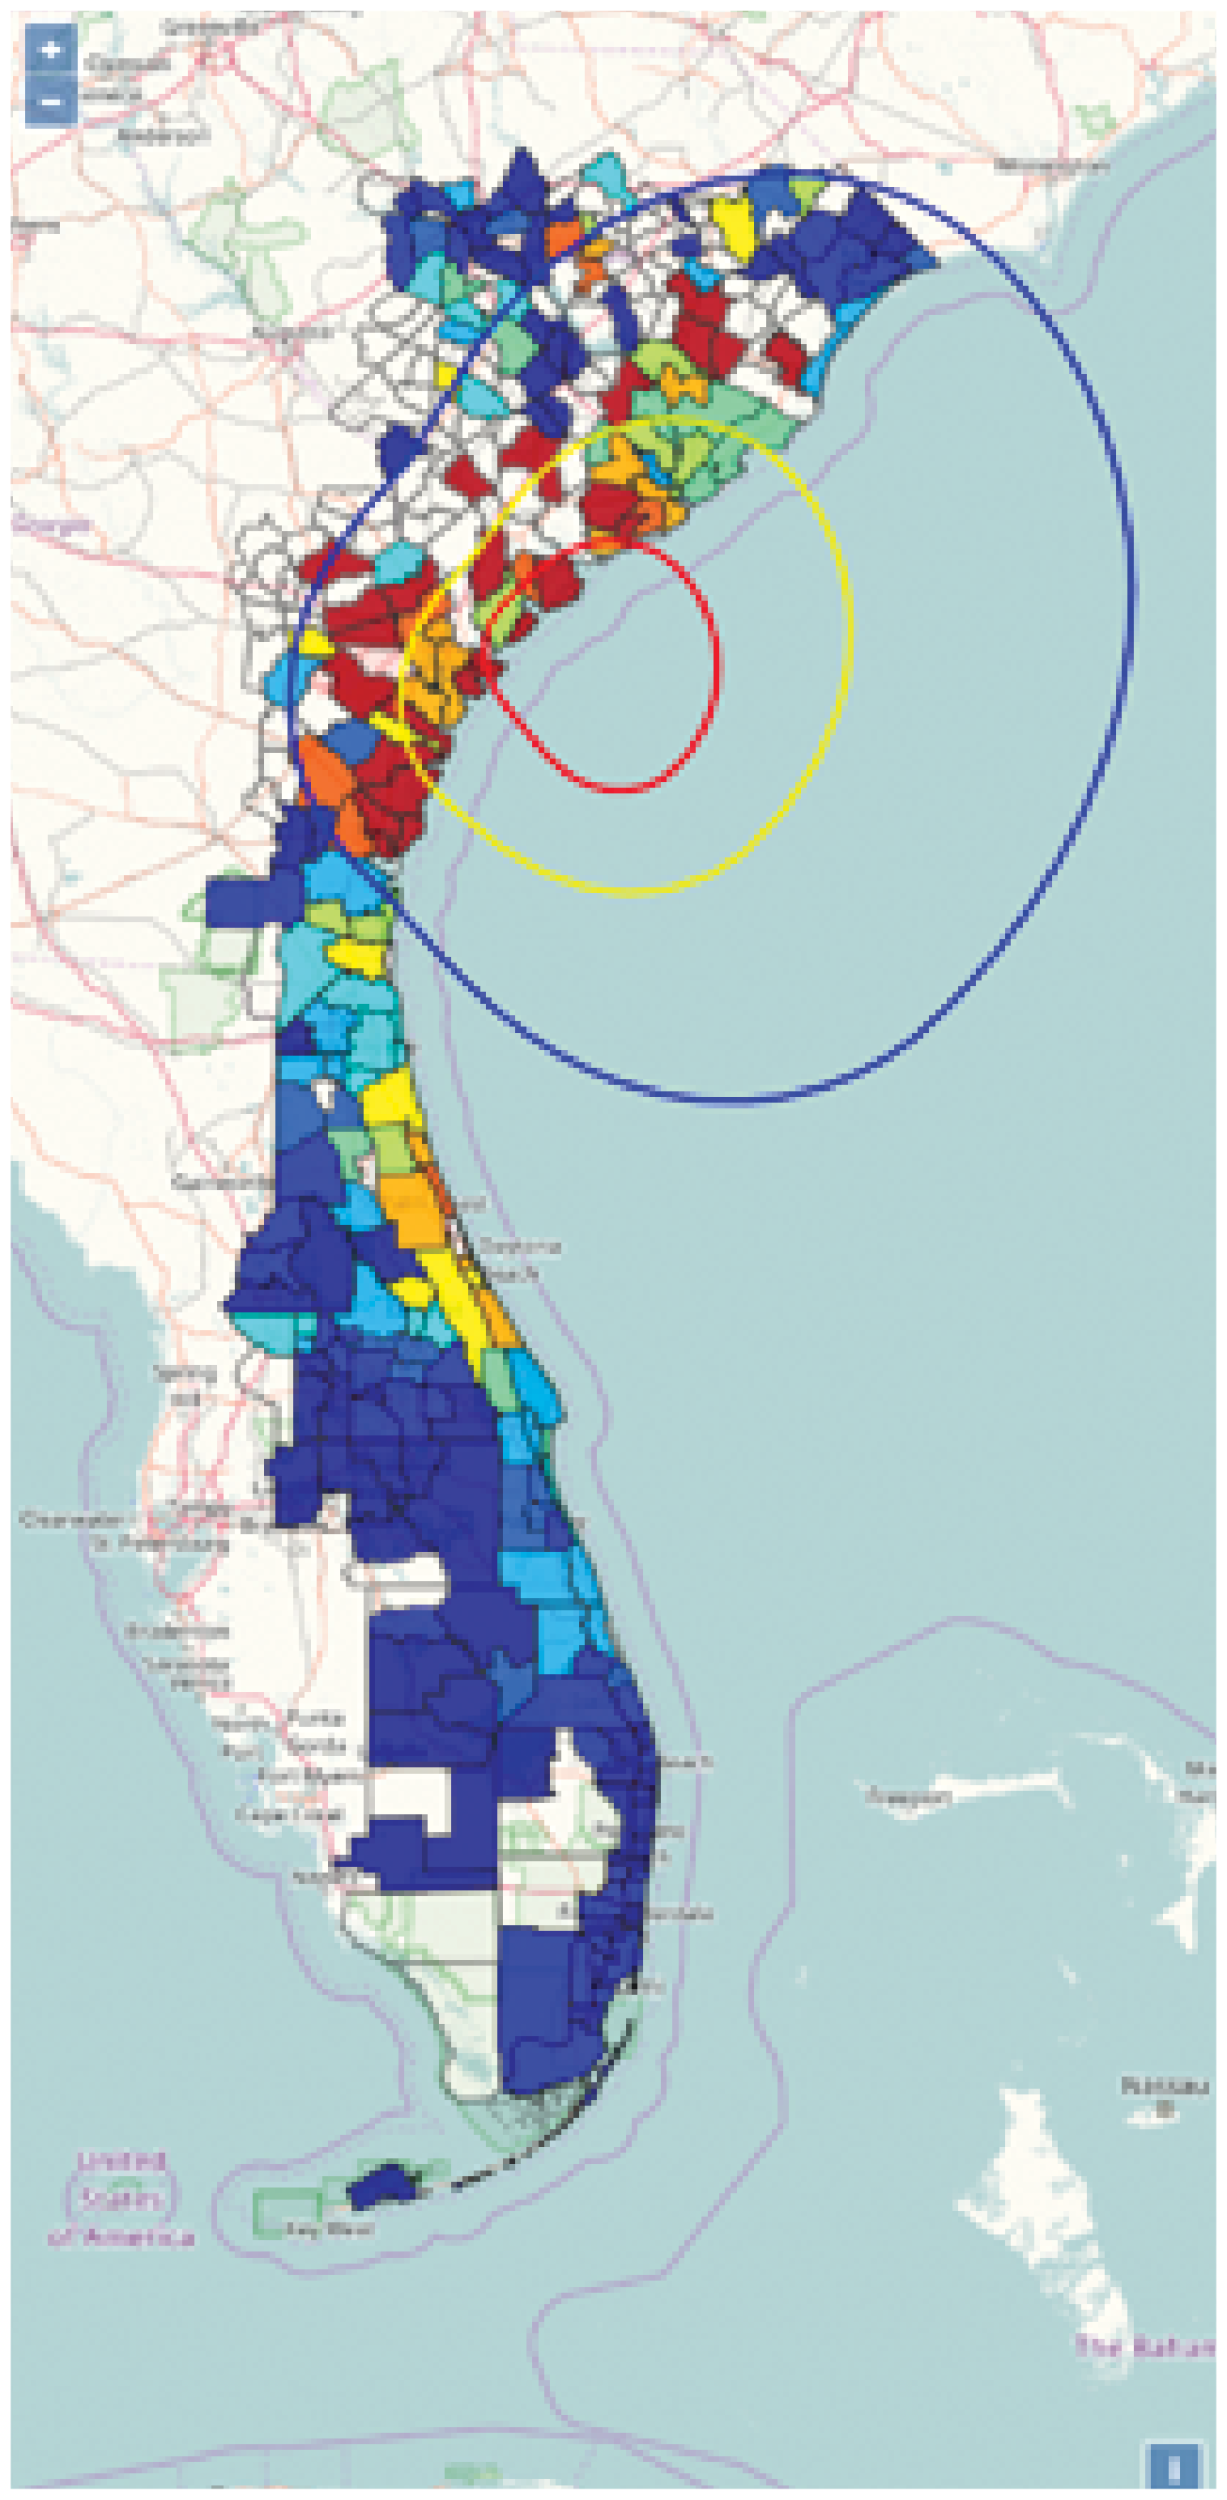
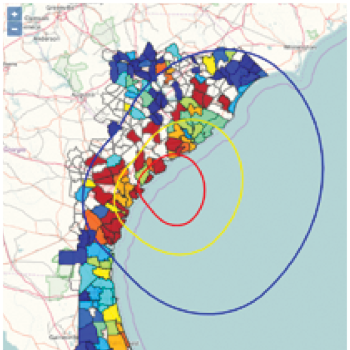
Lincoln Laboratory researchers created a software system that addresses the problem of managing data from large numbers of different utilities with dissimilar reporting standards. The system, which operates independent of information from utility companies, produces a single product that provides a broad picture of regional power outages that can be refined down to view a single town or zip code. It takes advantage of Internet-connected devices as an alternative sensing network, actively scanning IP networks in a targeted region to identify changes in network device availability as an indicator of power loss. The response rate detected by the current scan is compared to a baseline, previously acquired during times of normal internet conditions, to calculate post-disaster responsiveness as a percentage of normal responsiveness. On the basis of this percentage, the system automatically calculates an estimate of the percentage of customers with or without power and displays the estimated outages on a map that uses a color scale to depict 10% increments in power loss. The map can be updated regularly to reveal the severity of outages and the evolving restoration of electricity.
Benefits
- Produces outage data in one consistent format at any desired regular interval
- Can refine data by zip code, town, or county
- Estimates range of power outage without requiring costly hardware or personnel deployed to the field
- Easily and inexpensively scales up to cover more geographic area and/or to provide updates more frequently by adding more computer resources and network bandwidth