
LES-1
LES-1

LES‑1 Recordings
Launched into orbit in February 1965, LES-1 introduced several innovations that follow-on satellites in the LES series built upon to address military needs for reliable, long-range communications. After two years of demonstrations, LES-1 shut down its transmitter. The satellite remained silent until 2012, when amateur radio operators detected a telemetry signal from LES-1 at the ultrahigh frequency of 237 MHz. This spontaneous retransmission may have happened because of an electrical short in the LES-1 power system.
Lincoln Laboratory developed a system to record the signals from LES-1 every time the satellite passes over the Laboratory's main campus in Lexington, Massachusetts. An automated antenna atop a Laboratory building rooftop records the signals transmitted from LES-1 at key times: when LES-1 initially comes into view (rising), when LES-1 is at its highest point in the sky (culmination), and when LES-1 is going over the horizon (setting).
LES-1 makes a revolution around the Earth roughly every 2.6 hours. However, sometimes LES-1 is too low in latitude to be seen from the Laboratory. Also, because LES-1 only transmits when its solar panels are receiving sunlight and in turn generating power, it will occasionally be eclipsed by the Earth and will not transmit, even when the satellite is in view.
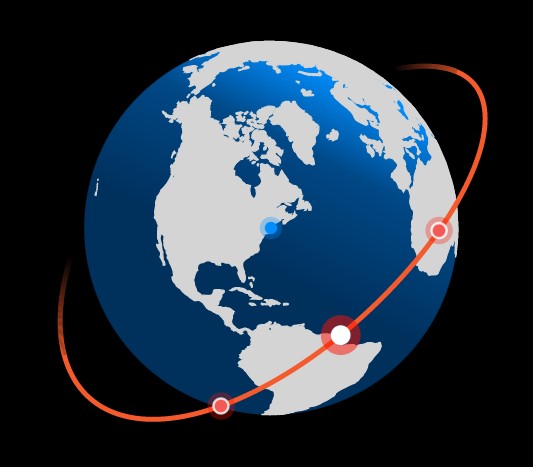
Visualizing the Orbit
This interactive tool shows the orbit and approximate position of LES-1 at the time of each recording.
The orange line represents the orbit of LES-1.
Orange dots represent locations where LES-1 recordings were captured during the rising, culmination, and setting of each pass.
The blue dot represents the recordings captured from Lincoln Laboratory's main campus in Lexington, Massachusetts.
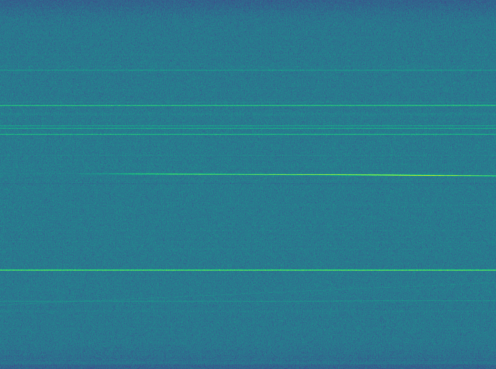
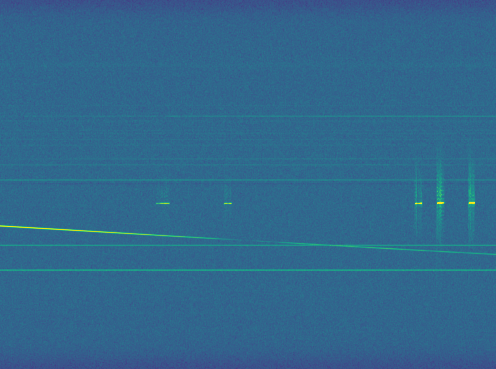
Understanding the Spectrogram
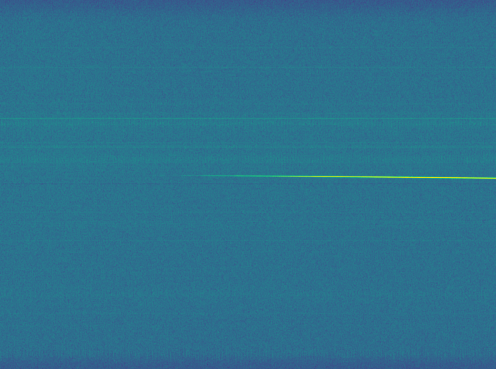
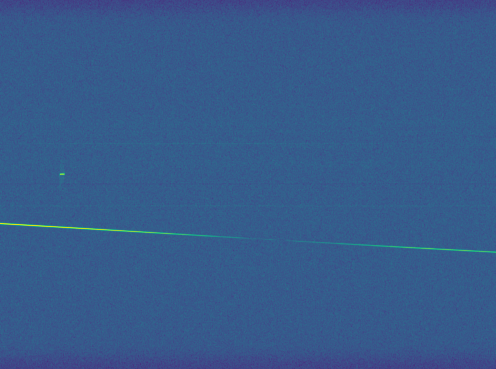
Each recording is converted into a spectrogram, a visual representation of the frequencies in the signal (y-axis) over time (x-axis). The signal sent by LES-1 is in its original, unmodulated form (a tone), so it appears as a single line in the spectrogram. Because of the relative motion of the satellite and ground antenna, the tone experiences a Doppler shift, or change in frequency. In turn, the received signal changes frequency throughout the satellite's pass. This change in frequency is greatest when the satellite is at its highest point (culmination), which appears as a sloped line in the spectrogram. The colors in the spectrogram correspond to the amount of power at each frequency in the signal — a measurement called the power spectral density.
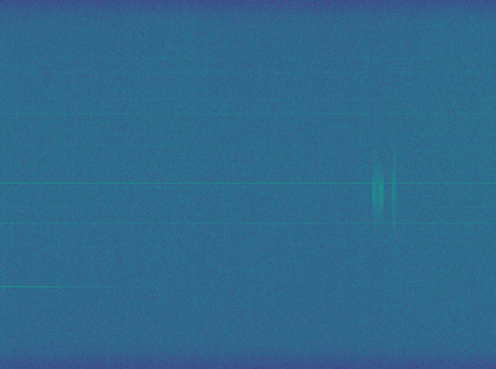
An example of the three captures during a single pass is shown below. In the first image, the satellite rises over the horizon, and the signal appears midway through the capture. In the second image, the satellite is approaching the culmination of the pass, and the frequency shifts lower during the capture. In the third image, the satellite sets over the horizon, and the signal disappears shortly after the start of the capture.
To find the LES-1 signal, hover over the spectrogram. The expected location of the signal is overlaid on the spectrogram.
The spectrogram may show artifacts (lines/blotches in the images below), which come from other, non-LES signals in the local environment during the recording. For example, some digital audio radio stations operate in the same frequency range as LES-1.
The time of each recording is displayed in UTC (Coordinated Universal Time).
${dateObj.month + ' ' + dateObj.day + ', ' + dateObj.year } ${ dateObj.time } UTC
